
Feed graph
Explore your content knowledge graph
Graph maps people, topics, and posts from your captures into a neighborhood you can search and click through.
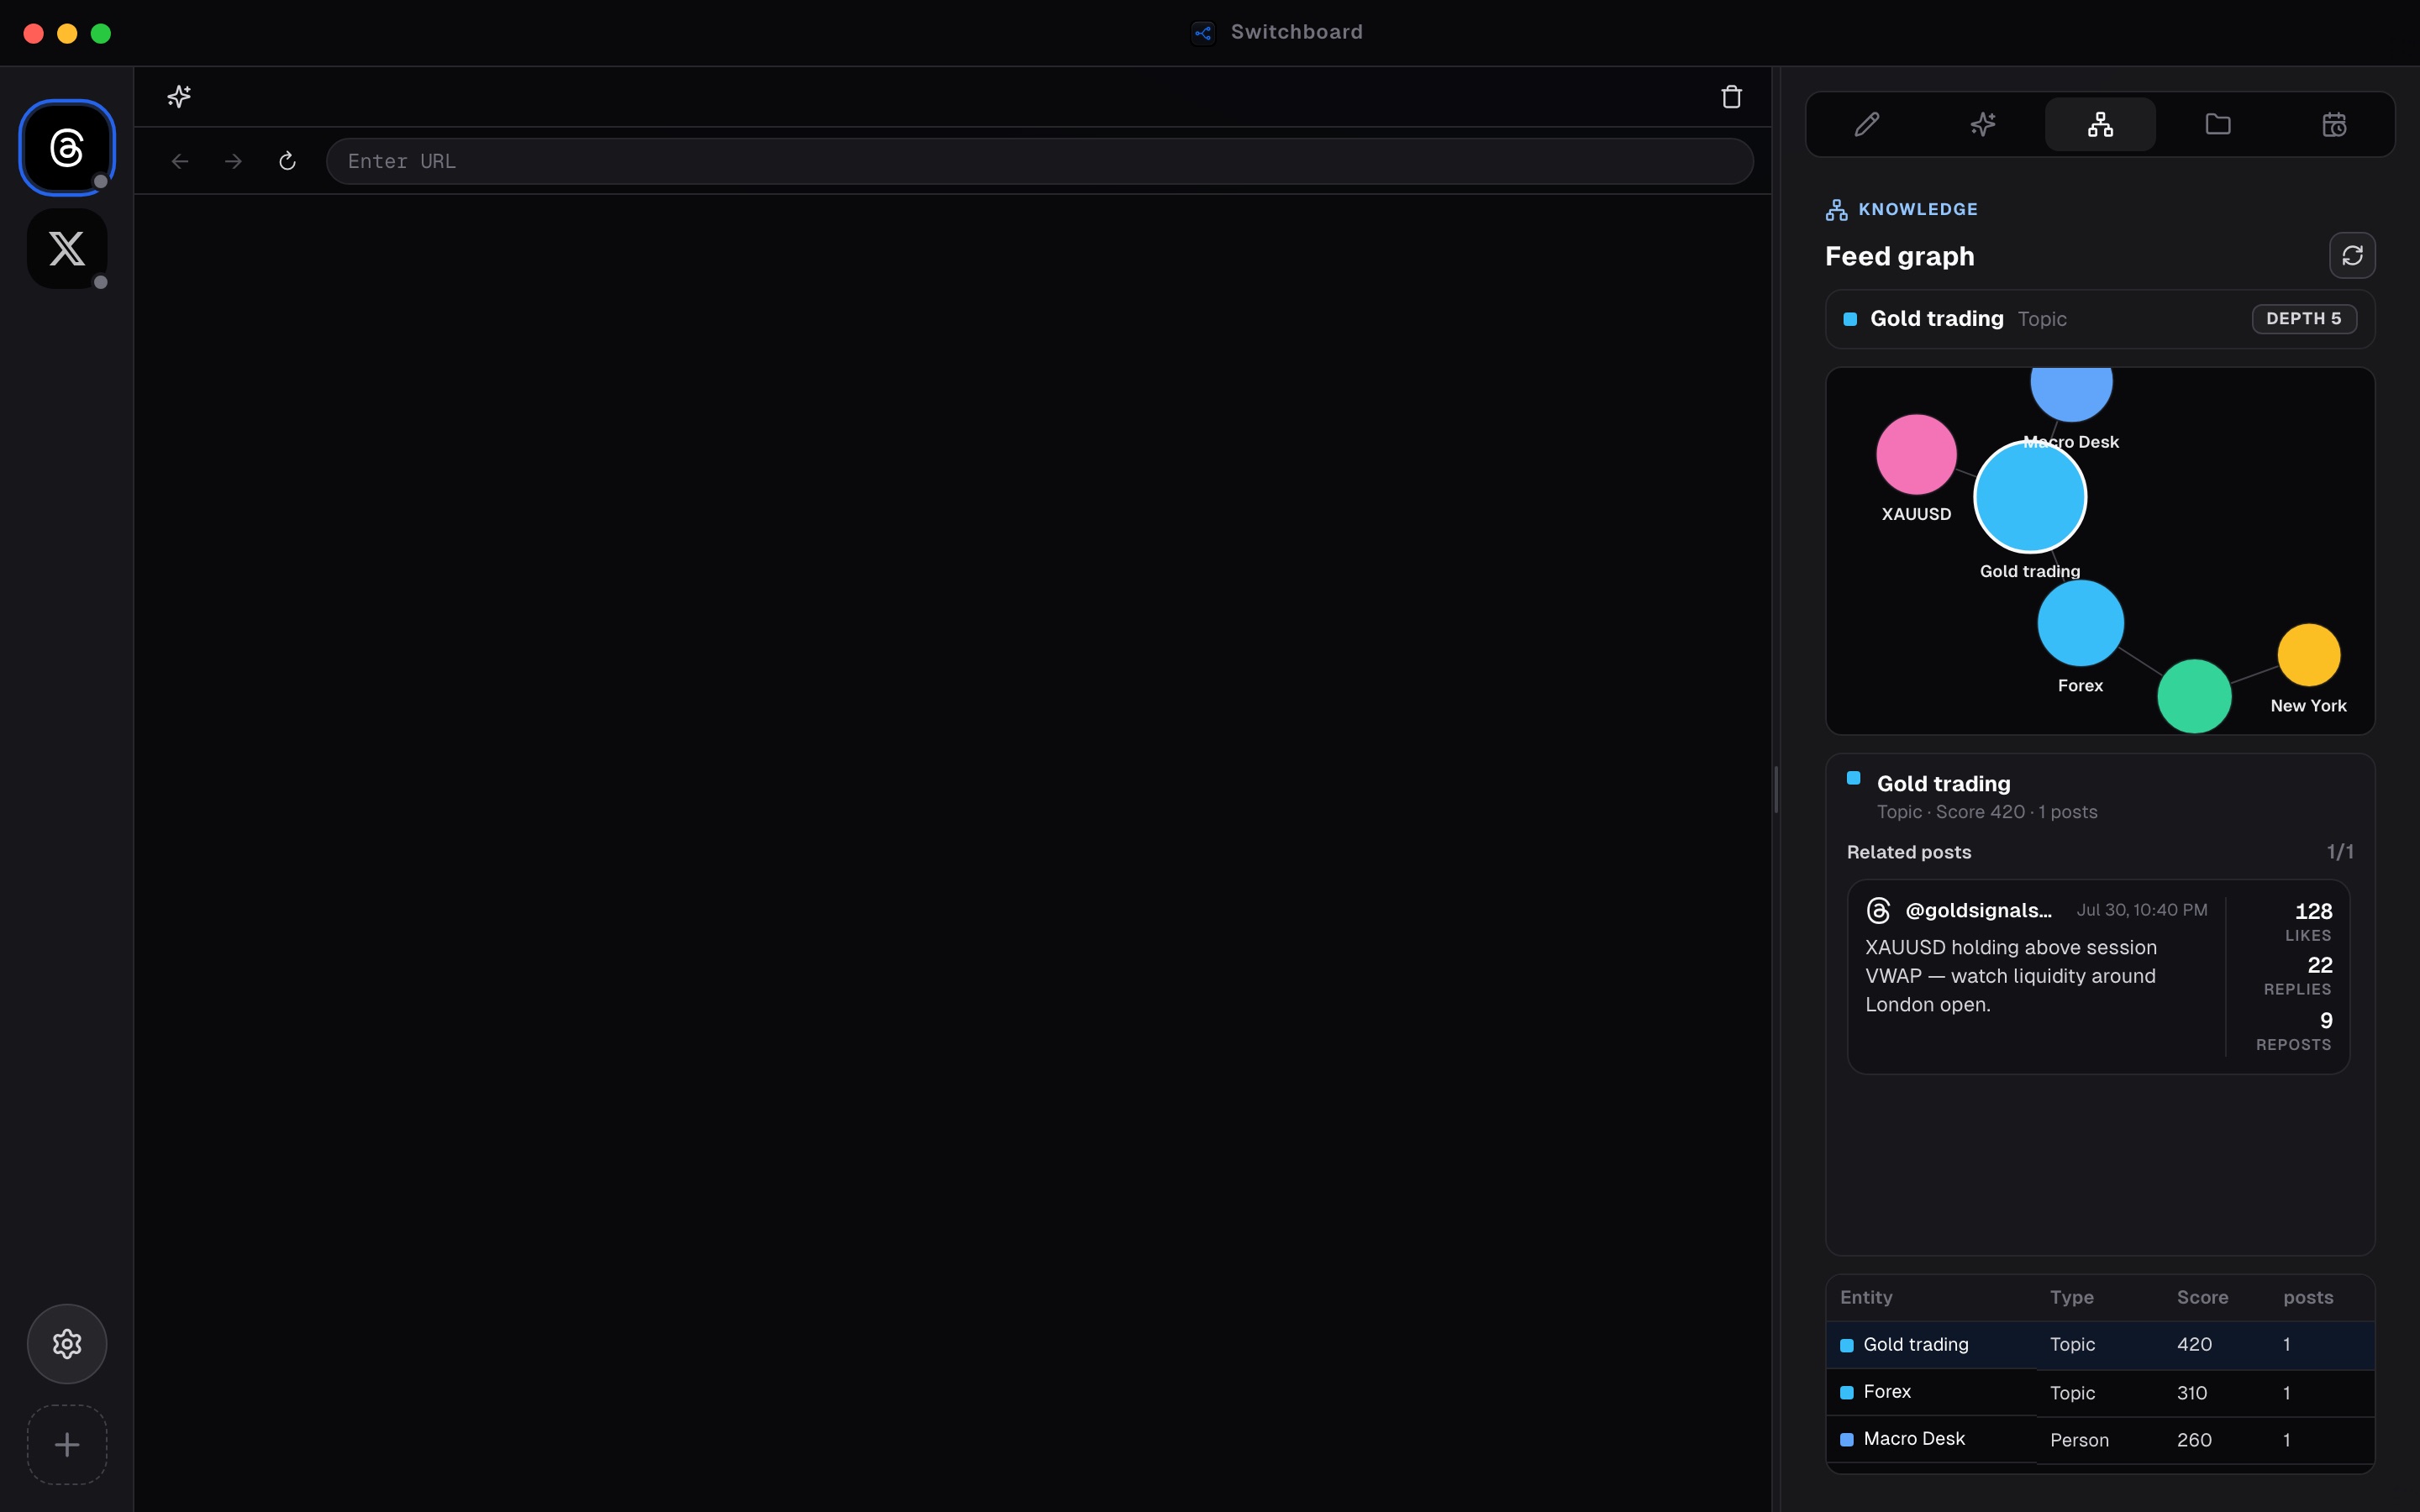
The feed knowledge graph turns captures into a map of entities — people, topics, brands, products, places — and the relationships between them. Open Graph in the Content panel to load a neighborhood built from cloud-synced captures.
Click or search an entity to expand depth around it. Related posts appear under the visualization so you can read the original context before you write. Depth controls how far the neighborhood expands from the selected node.
Use the graph when you want structural intuition: who keeps showing up next to a theme, which products cluster with a topic, or which posts bridge two ideas.
Steps
- 01
Open Graph
Select the Graph tab in the Content panel to load the knowledge graph for your cloud-synced captures.
- 02
Pick an entity
Search or click a person, topic, or post node to expand its neighborhood and see how ideas connect.
- 03
Read related posts
Related captures appear under the graph — open a card to review the original content before you draft.
Frequently asked questions
Where does graph data come from?
Entities and relationships are derived from cloud-processed feed captures after you sync (with feed share enabled). Local-only captures are not enough for the cloud graph APIs.
What can I click in the graph?
Nodes for topics, people, brands, products, places, and related posts. Selecting a node expands its neighborhood and lists related captures below.
What does Depth mean?
Depth is how many relationship hops to expand from the selected entity. Higher depth shows a wider neighborhood (up to the product limit).
Can agents use the graph?
Graph viewing is a desktop UI feature today. Automation still centers on MCP eyes/hands and platform tools; use the graph yourself for research, then draft or automate from there.